🪞 Introduction
Most devs use Chrome DevTools every single day, but most of us only scratch the surface.
We live in the Console + Elements tab loop, tossing in console.log()s, tweaking CSS, and refreshing pages like it’s 2010. But Chrome’s DevTools team has quietly added a ton of powerful features that can actually make debugging and optimizing your apps… dare I say, fun?
This post highlights seven of my favorite hidden gems that’ll help you debug smarter, not harder.
💎 1. CSS Overview: See Your Styles Like Never Before
If you’ve ever looked at your project’s CSS and thought, “Why are there twelve shades of gray?”, this one’s for you.
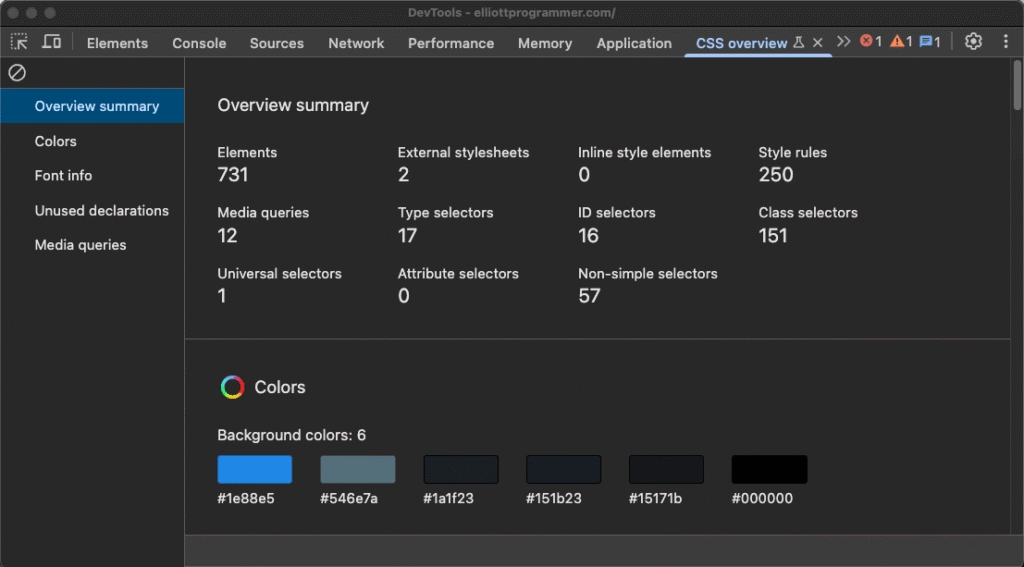
The CSS Overview panel gives you a big-picture snapshot of your site’s design system, listing every color, font, and potential issue (like low contrast or redundant values).
To open it:
- Press Cmd/Ctrl + Shift + P
- Type CSS Overview
- Click “Capture Overview”
You’ll get a dashboard showing:
- All colors used (great for spotting duplicates)
- Font families and sizes
- Unused or duplicate style declarations
- Contrast issues
It’s like a design audit built right into DevTools, helping you keep your UI consistent and accessible.
Pro tip: You can click on any color or font in the report to jump directly to where it’s used in your code.
🎨 2. The CSS Shadow Editor
Box shadows can be… well, finicky. Especially when you’re eyeballing values like 3px 7px 14px rgba(0, 0, 0, 0.25) and hoping it looks right.
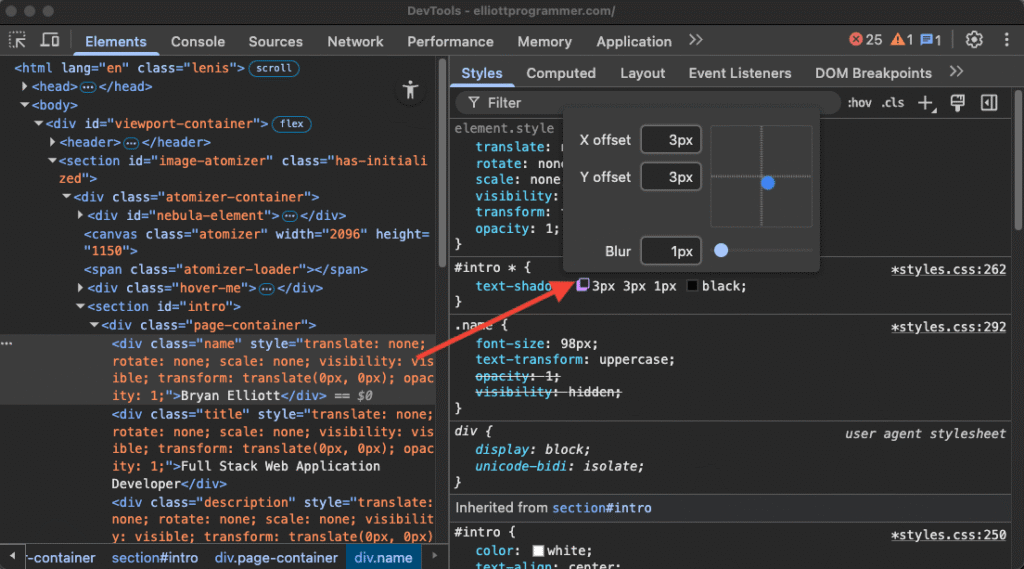
The CSS Shadow Editor makes that a visual process.
Just inspect an element that already has a box-shadow, and click the small color-swatch icon next to it. A full editor opens where you can adjust:
- Offset X / Y
- Blur & spread radius
- Color
- Inset / outset
As you tweak, the live preview updates instantly. When it looks perfect, copy the resulting CSS with one click.
No more flipping between online generators or guessing at blur values. DevTools has your back.
📊 3. Coverage Tool: Find What Code Actually Runs
Ever wonder how much of your bundled JavaScript or CSS is actually used when your site loads?
The Coverage tab will show you exactly that.
To open it:
- Open Command Menu (Cmd/Ctrl + Shift + P)
- Type Show Coverage
- Click the reload icon in the Coverage panel
You’ll get a list of all JS and CSS files, with red and green bars showing how much of each file is unused vs. executed.
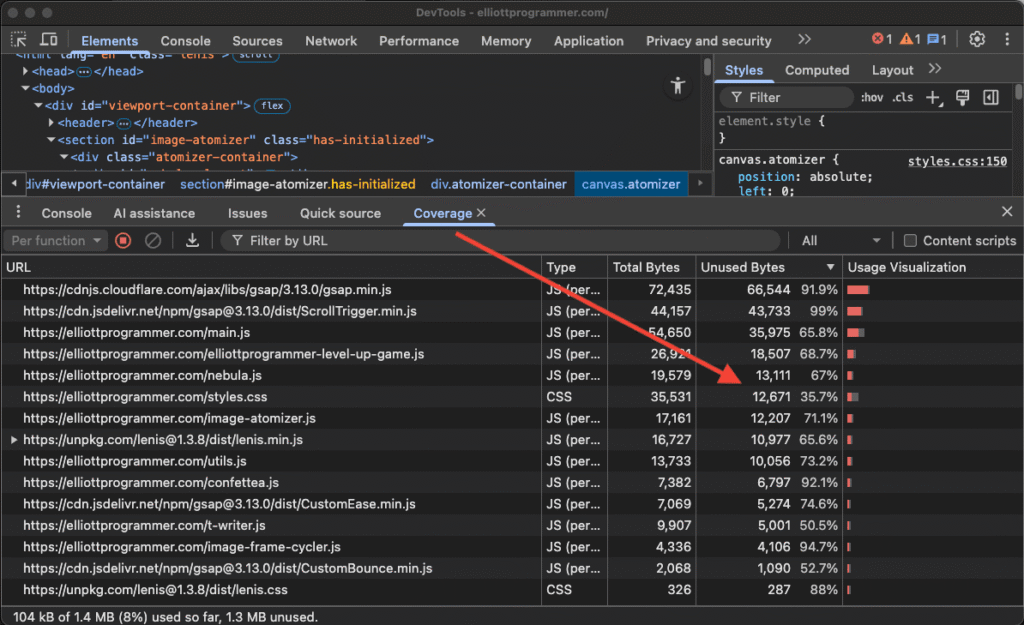
It’s common to see 70–90% of large JS files unused on initial load, which means huge performance gains are sitting right there if you lazy-load or refactor.
💡 Try interacting with the page while the Coverage tab is open! It updates live as your scripts run.
🪄 4. Logpoints: Console Logging Without Editing Code
Still scattering console.log()s across your files to track variables? You can skip that step entirely.
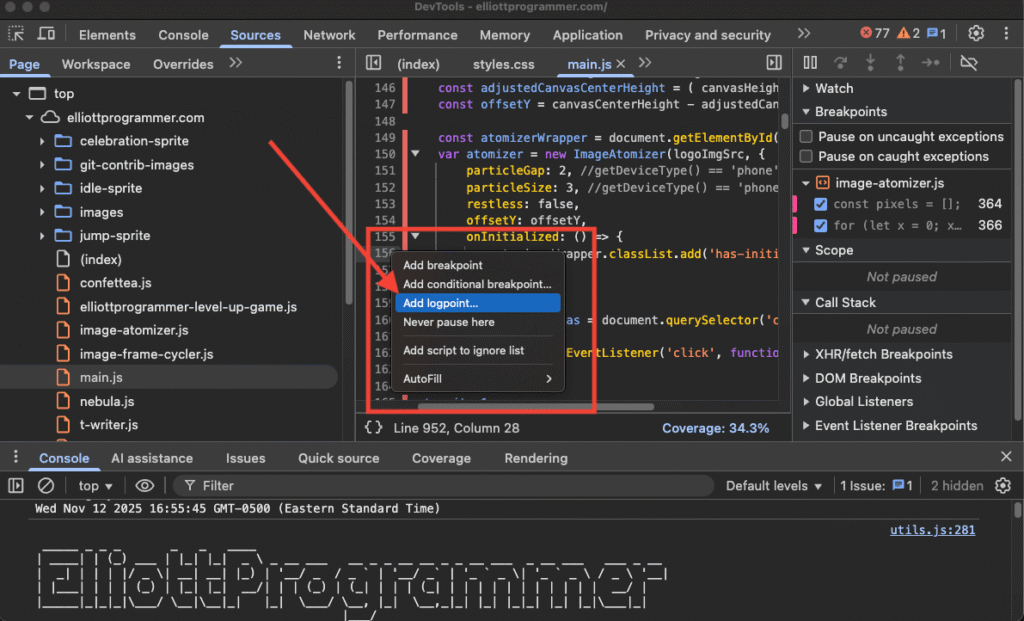
DevTools lets you add logpoints directly in the Sources panel! No code edits required.
Here’s how:
- Open the Sources tab
- Right-click a line number
- Choose “Add logpoint”
- Type your message (and include variables like ${foo})
Logpoints behave like console.log() but don’t modify your source files. They even persist across page reloads.
Bonus tip: You can also add conditional breakpoints (e.g., only pause when cart.length > 5). These save so much time when chasing tricky bugs.
📸 5. Capture Node Screenshot
Need to grab a screenshot of a specific element… not the entire page?
Right-click any DOM node in the Elements panel and choose “Capture node screenshot”!
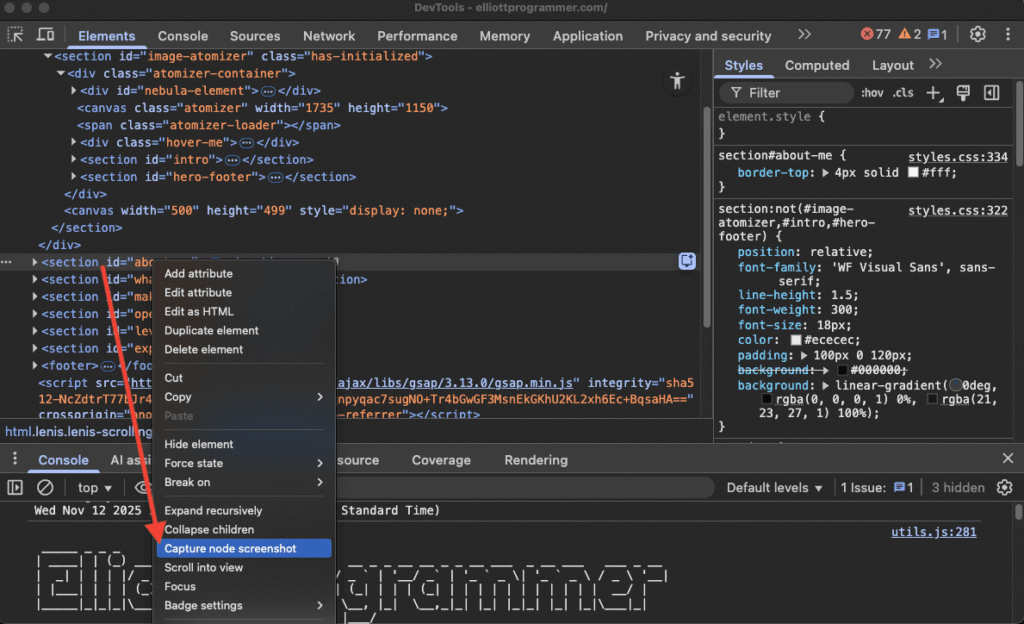
DevTools will instantly export a PNG of just that element, perfectly cropped.
This is perfect for:
- Capturing hover states or modals
- Sharing specific UI components with your team
- Creating quick before/after bug fix shots
And if you need a full-page screenshot (beyond your viewport), open the Command Menu and type “Capture full size screenshot”! It scrolls and stitches the entire page automatically.
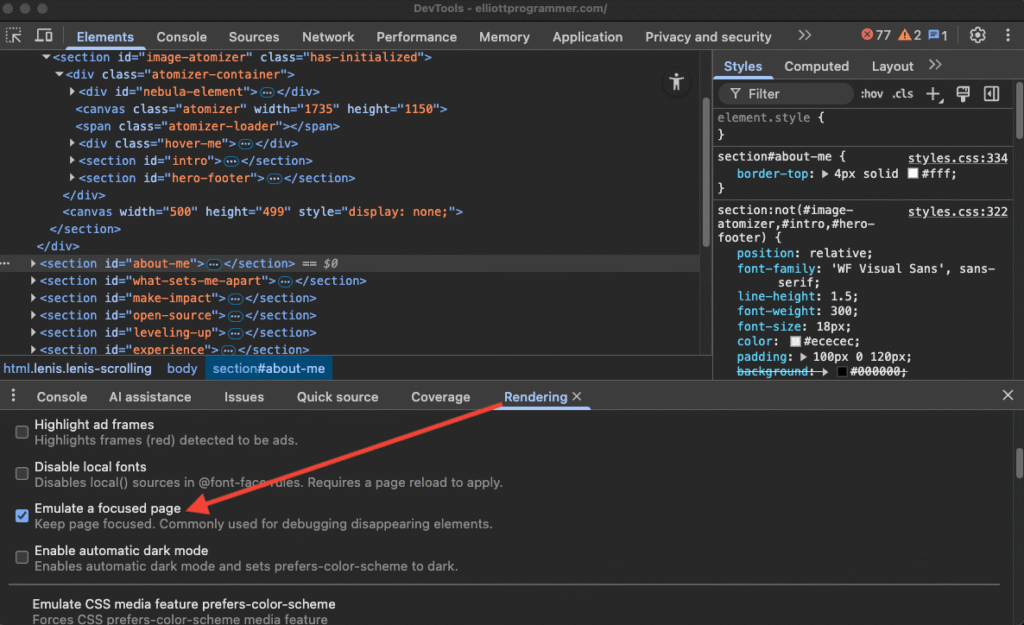
👀 6. Emulate a Focused Page
Here’s a problem every frontend dev knows:
You open a dropdown, modal, or hover menu… then switch to DevTools to inspect it… and poof! It disappears (because it loses focus).
Enter “Emulate a focused page.”
Go to the Rendering tab (you can open it via Command Menu → “Rendering”) and scroll down until you see this option. Check it, and now the browser will act like the page is still focused even when you’re clicking around DevTools.
This is a lifesaver for debugging focus/hover states, capturing transient elements, or inspecting active dropdowns without chasing them across reloads.
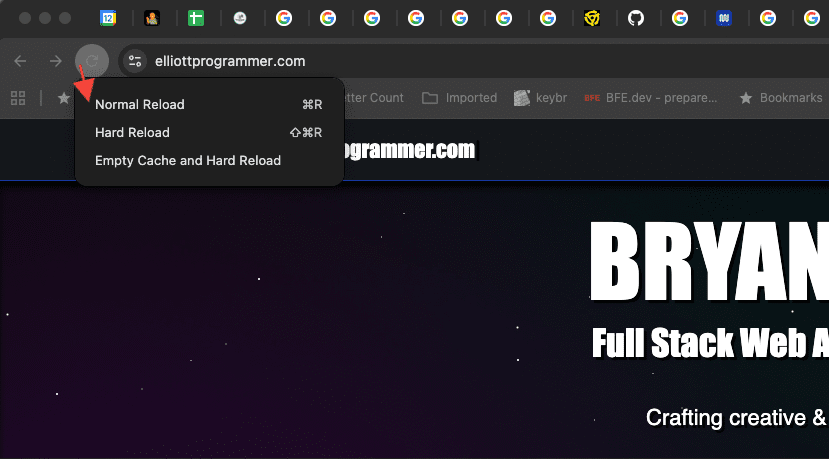
🔁 7. Reload Variants
If you’re constantly clearing cache or doing hard reloads, there’s a hidden shortcut:
Just long-press (or right-click) the Reload 🔄 button in Chrome, and you’ll see three reload options:
Note: Dev-Tools must be open for this to work.
- Normal reload – regular refresh
- Hard reload – skips cached files
- Empty cache and hard reload – fully clears cache, then reloads
This simple trick saves countless clicks and ensures you’re testing with a fresh environment. Perfect when debugging service workers, caching bugs, or stale asset issues.
🧩 Bonus: Pairing These Tools for Real-World Wins
The real magic happens when you combine these features.
Example workflow:
- Start with Coverage to identify heavy unused code.
- Use CSS Overview to clean up duplicate styles.
- Tweak visuals with Shadow Editor while capturing reference shots with Capture Node Screenshot.
- Verify states with Emulate Focused Page and finally Hard Reload to confirm fixes.
This combo can turn a clunky debugging session into a smooth, productive clean-up flow… all inside DevTools!
🧠 Quick Reference
| Feature | Shortcut / Path | Best For |
|---|---|---|
| CSS Overview | Cmd/Ctrl + Shift + P → “CSS Overview” | Auditing color, font, and contrast issues |
| CSS Shadow Editor | Styles panel → box-shadow → swatch icon | Visualizing and refining shadows |
| Coverage Tool | Cmd/Ctrl + Shift + P → “Show Coverage” | Identifying unused JS/CSS |
| Logpoints | Sources panel → right-click line number | Debugging without editing source |
| Capture Node Screenshot | Elements panel → right-click node | Targeted screenshots |
| Emulate Focused Page | Rendering tab → check option | Inspecting hover/focus states |
| Reload Variants | Long-press Reload button | Clearing cache / fresh reloads |
💡 Closing Thoughts
Mastering DevTools isn’t about memorizing shortcuts, it’s about leveraging hidden tools that make you faster and more confident.
Next time you open Chrome’s DevTools, don’t just reach for the Console. Explore a new tab. Click a little gear icon you’ve never noticed before. You might just find your next favorite debugging trick.
Because at the end of the day, the best developers aren’t the ones who type code the fastest, they’re the ones who best utilize the tools before them and debug smarter.
👉 Coming soon: AI Assistance in Chrome Dev Tools! — I’ll be writing an article soon describing and demonstrating many of the AI features in Chrome Dev Tools! So stay tuned on blog.elliottprogrammer.com or on LinkedIn.