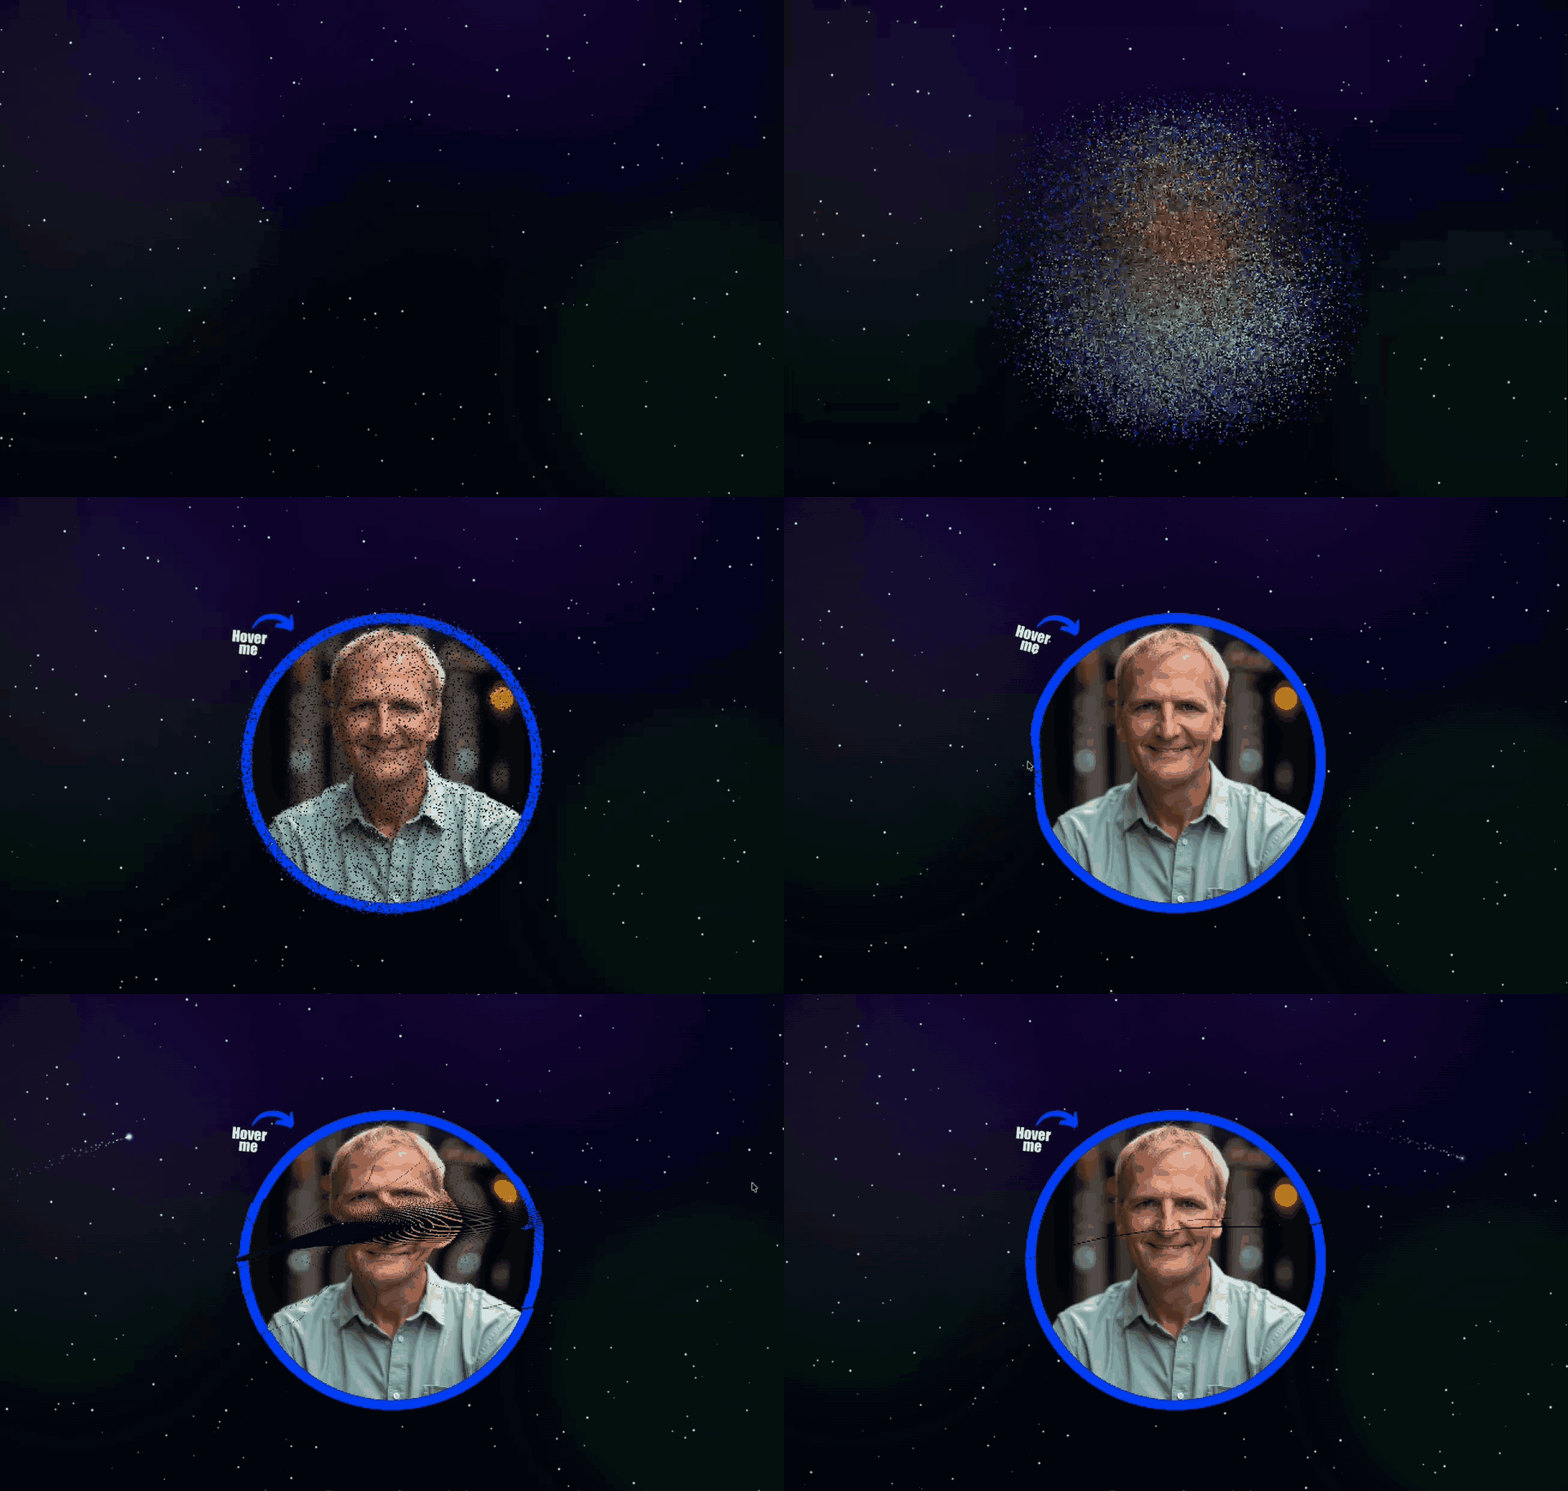
I’ve been working on image-atomizer-js — a canvas effect that turns an image into thousands of particles (“atoms”) that settle into place and react to mouse hover/touch.
This kind of project can be a performance trap, if you’re not careful:
- lots of particles
- an update loop every frame
- a render step that touches a lot of pixels
- and (on my site) it’s composited with a background starfield (another animation loop) to create one “scene”
This post is a write-up of the four biggest optimizations that moved the needle, plus the real perf logs I captured after each step.

Step 0: Measure first (so you can prove it)
Before optimizing anything, I added a tiny performance logger to the animation loop.
It logs once every N frames (I used 120) and prints:
avgFrameMs: average total frame timeavgDrawMs: average time spent inside the draw routinefps: derived fromavgFrameMs
This kind of logging is incredibly useful because it captures frame consistency, not just an eyeballed “FPS feels better.”
Baseline (before any improvements)
From my saved logs, baseline performance looked like this:
avgFrameMs: ~3.57–3.99msavgDrawMs: ~2.09–2.32msfps: ~250–280
Example line:
frames=120 avgFrameMs=3.88 avgDrawMs=2.20 fps=257.6
Even at “high FPS,” you can still feel jank if frame time spikes or if the main thread gets busy doing other work.
Optimization #1: Reuse the pixel buffer + simplify the inner-loop math
This was the first major win, and it was actually two tightly-related changes:
A) Reuse ImageData instead of allocating it every frame
The original draw path was effectively:
- create a new full-canvas
ImageData - write particle pixels into it
putImageDatait back to the canvas
That means huge allocations and huge memory writes every frame.
The fix: allocate ImageData once (or whenever the canvas size changes), and reuse it every frame, clearing it before drawing (e.g. data.fill(0)).
Why this matters:
- less GC pressure
- fewer random long frames
- less memory bandwidth churn
B) Simplify Particle.move (remove trig + Math.pow)
The hot path was doing expensive math per particle:
- trig (
atan2,sin,cos) Math.pow(dx, 2)Math.pow(0.90, timeStep)per particle
The refactor switched to cheaper vector math (distance-squared checks, normalized direction only when needed) and moved damping to a per-frame constant.
Results after Optimization #1
Saved logs after this step:
avgFrameMs: ~1.02–1.35msavgDrawMs: ~0.80–1.05msfps: ~740–980
Example:
frames=120 avgFrameMs=1.25 avgDrawMs=0.96 fps=798.9
This is the “Big One”: it cut the average frame time by roughly 3×!
Optimization #2: Packed pixel writes with Uint32Array
Even after buffer reuse, the draw loop still wrote pixels channel-by-channel (R, G, B, A). That’s four writes per pixel.
The next optimization was to:
- create a cached
Uint32Arrayview over theImageData.databuffer - pack colors into a single 32-bit value
- write one
Uint32per pixel - clear with
data32.fill(0) - do a one-time little-endian check (warn if not)
Results after Optimization #2
Saved logs after switching to packed Uint32Array writes:
avgFrameMs: ~0.85–1.18msavgDrawMs: ~0.69–0.98msfps: ~846–1175
Example:
frames=120 avgFrameMs=0.97 avgDrawMs=0.78 fps=1033.6
The improvement here is mostly in avgDrawMs (which makes sense: this is a draw-path optimization).
Optimization #3: Replace the particle system with a typed-array (struct-of-arrays) layout
At this point the main remaining cost was the update loop touching a lot of per-particle state.
The original implementation stored particles as objects and (earlier) even used linked-list style pointers.
The refactor switched to typed arrays (a “struct-of-arrays” layout):
- positions:
Float32Array - velocities:
Float32Array - targets/gravity:
Float32Array - TTL:
Float32Array - packed colors:
Uint32Array
…and it kept a dense activeCount range with swap-with-last removal, so iteration stays contiguous.
It also preserved the “optional color function” behavior by storing function references separately alongside a small flag.
Results after Optimization #3
Saved logs after the typed-array particle refactor:
avgFrameMs: ~0.75–1.01msavgDrawMs: ~0.45–0.59msfps: ~988–1342
Example:
frames=120 avgFrameMs=0.94 avgDrawMs=0.54 fps=1061.9
The key thing here isn’t just FPS. The animation felt smoother because both update and draw got more predictable.
Optimization #4: Move the whole simulation + rendering off the main thread (OffscreenCanvas + Worker)
After optimizing the math and memory access patterns, the next leap was architectural:
- Use OffscreenCanvas
- Run the animation in a Web Worker
- Keep the main thread free for layout, input, other animations, etc.
This is behind an option flag, because OffscreenCanvas support varies by browser.
Results after Optimization #4
Saved logs from the worker path:
avgFrameMs: ~0.72–0.89msavgDrawMs: ~0.43–0.55msfps: ~1126–1397
Example:
frames=120 avgFrameMs=0.73 avgDrawMs=0.43 fps=1377.7
Even when “FPS is already high,” this kind of change can make the page feel calmer because the main thread has more breathing room.
Takeaways
The big lessons I’d generalize from this:
- Stop allocating big buffers every frame. Reuse memory.
- Make the inner loop cheap. Avoid trig and repeated expensive operations.
- Prefer contiguous data layouts for hot particle loops (arrays / typed arrays).
- If you’re still fighting jank, get off the main thread.
